This article is about the Reporting stage in a Marketing Tools broadcast, which is available once the broadcast has been sent. There are several stages which can be worked on individually (and in almost any order):
- Setup – the name and type of broadcast
- Audience – who the broadcast will go to
- Message – the broadcast message itself
- Testing – testing the message by sending tests to yourself, colleagues or a seed list
- Sending – sending the message
- Reporting – reporting on a sent message
Reporting on a broadcast
You can report on a Broadcast by clicking the Reporting stage when editing a broadcast, or by clicking on the reporting icon in the list of broadcasts under the Marketing Tools > Messaging > Broadcasts menu ![]()
 The reporting screen is split into several areas with different statistics:
Top area (four boxes)
- Engagement Count
- Single Donations
- Recurring Donations
- Total Donations
Message list
This contains a list of any messages within the broadcast. You may only have one, but if you have used conditional content or split tests then multiple messages will be seen.
Each one will have scrollable statistics which can be downloaded as a CSV (top-right button):
- Sent – the number of supporters sent this message
- Opens – how many supporters opened this message
- Open rate – the percentage of opens (Opens/Sent)
- Clicks – the number of clicks on links within the message
- Click Rate – the percentage of clicks (Clicks/Sent)
- Unsub – the number of unsubscribes
- Unsub Rate – the percentage of unsubscriptions (Unsub/Sent)
- Bounce – the number of hard bounces
- Bounce Rate – the percentage of unsubscriptions (Bounce/Sent)
- Spam – the number of emails marked as spam by the supporter (if you see high amounts of these you may be sending to supporters not expecting to get your emails, e.g. they are not opted-in. Check your query and get in touch with Support with any questions)
- Donations – the number of donations made from the message
- Advocacy count – the number of advocacy actions made from the message
- Engagement count – the number of engagement actions made from the message
Performance
This shows a line graph of opens over time. You can switch to By Hour or By Day
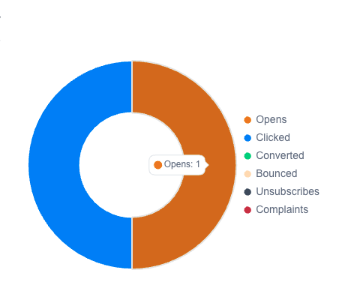 It also shows a pie chart showing the number of different types of activity – opens, clicks, converted, bounced, complaints. As of release 4.8, you can hover over the subject to view it:
Links
This shows the number of clicks per link. If you have not named your link when adding it, a random code will show.
Actions by Page
The number of actions taken through links in the message